Read-Intensive Workloads Drive QLC Adoption for Cloud and Enterprise Storage
The Capacity You Need With Performance that is Just Right
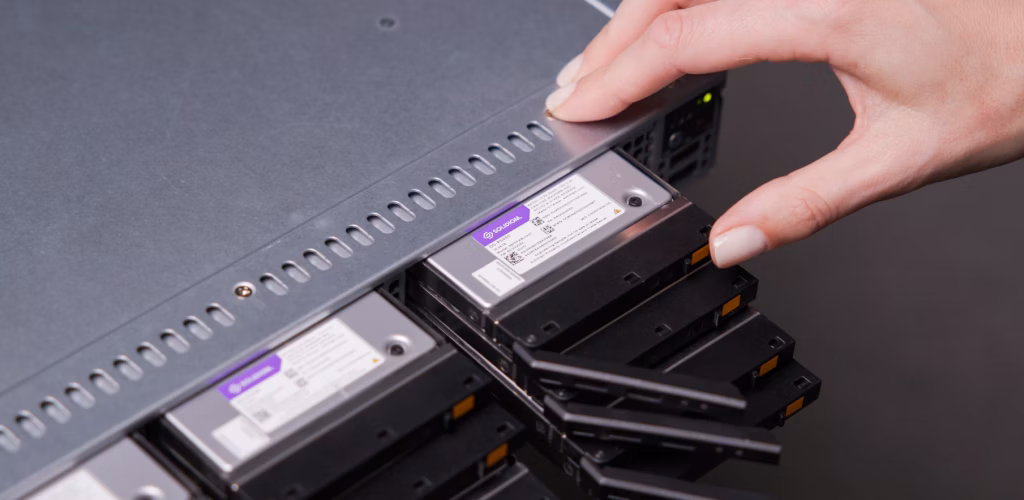
Solidigm™ D5-P5430 QLC SSDs provide the right performance, density, and total cost of ownership for today’s mainstream workloads.
Storage workloads have changed
It seems the world today has an endless ability to create and consume increasingly vast amounts of data. This data tsunami has fundamentally reshaped storage needs, with accelerated growth in read-intensive workloads accompanied by a steady decline in SSD endurance levels on average. Two recent large-scale studies illustrate this point:
- 94% of workloads are read-intensive, with a median read-to-write ratio of approximately 78/22 [1]
- 99% of SSDs consume less than 15% of their usable life [2]
Read-intensive workloads are everywhere
Mainstream and read-intensive workloads are ubiquitous in the cloud and in enterprise storage. Mainstream workloads include applications and usages such as email and unified communications and collaboration servers, general-purpose servers, object-based storage, virtual desktop infrastructure (VDI), and more. These workloads tend to cluster around an 80/20 read-to-write mix, and are widely deployed in most enterprises. On the higher range, read-intensive usages and applications such as content delivery networks (CDNs), data lakes, data pipelines, imaging databases, video-on-demand (VOD) services, and more cluster around the 90/10 or higher read-to-write mix.
The best fit for these workloads
In our read-intensive world, triple-level cell (TLC) SSDs might not be right-sized for these applications. While they deliver strong read performance, these drives might not provide the best fit for mainstream and read-intensive workloads for a few reasons:
- Most workloads are composed of low write activity
- An overwhelming majority of SSDs use less than 15% of their rated drive life [2]
- When considering available form factors and maximum capacity points, TLC SSDs only support one-fourth of the capacity in the same space as quad-level cell (QLC) SSDs [3]
QLC SSDs: Right-sized for mainstream and read-intensive workloads
Solidigm QLC SSDs deliver read performance that’s equivalent to TLC SSDs, along with strong write performance and ample endurance for many workloads. The following table, normalized on a TLC SSD, shows how QLC performance, endurance, and maximum-capacity-per-drive compares with a range of TLC SSDs.

Table 1. Comparison of Solidigm D5-P5430 vs competitor SSDs [4,5]
Endurance concerns emerge with bit-per-cell transitions. With Solidigm QLC SSDs delivering 3,000 program/erase (PE) cycles on massive capacities available, lifetime writes (in petabytes written [PBW]) can exceed TLC SSDs.
Even more important than PBW is the reality of endurance needs. A large-scale study showing the read dominance of most workloads also examined how many TLC SSDs in its dataset of approximately 2 million drives could have used QLC SSDs instead. The study found that at 1,000 PE cycles, almost 95% of those drives could have been replaced with QLC SSDs, while at 3,000 PE cycles (coincidentally the rating for the D5-P5430 QLC drive), the opportunity would increase to nearly 99%. [1] This points to a massive opportunity to “right-size” SSDs for mainstream and read-intensive workloads to deliver more value.
QLC benefits
QLC SSDs are suitable for a wide range of workloads. In addition, IT administrators can realize up to 3x smaller rack footprint, 20% lower energy cost, and 31% lower total solution cost versus an all-TLC array for object storage. [6] The Solidigm D5-P5430 shows the density, total cost of ownership, and sustainability opportunities ahead for these workloads.
Notes
[1] USENIX. “A Study of SSD Reliability in Large Scale Enterprise Storage Deployments.” February 2020. www.usenix.org/conference/fast20/presentation/maneas.
[2] USENIX. “Operational Characteristics of SSDs in Enterprise Storage Systems: A Large-Scale Field Study.” February 2022. www.usenix.org/system/files/fast22-maneas.pdf.
[3] Maximum 48 E3.S drives and 24 U.2 drives per 2U chassis. E3.S vs. U.2 – 15.36TB U.2 Micron 7450 Pro yields 15.36TB x 24 = 368.64TB while 30.72TB D5-P5430 yields 30.72TB x 48 = 1474.56TB resulting in 4X more capacity with D5-P5430.
[4] Solidigm performance and PBW using 100% 16K RW for D5-P5336 and 100% 4K RW for D5-P5430. Samsung, Micron, and KIOXIA performance and PBW from highest capacity drives available. Sources: Samsung. “Samsung V-NAND SSD PM9A3.” 2022. https://image.semiconductor.samsung.com/resources/data-sheet/Samsung_SSD_PM9A3_Data_Sheet_Rev1.0.pdf. Micron. “Micron® 7450 SSD With NVMe®.” May 2022. https://media-www.micron.com/-/media/client/global/documents/products/product-flyer/7450_nvme_ssd_product_brief.pdf. KIOXIA. “CD6-R Series (KCD61LUL/KCD6XLUL/KCD6DLUL/KCD6FLUL) Data Center NVMe™ Read-intensive SSD.” 2022. https://americas.kioxia.com/content/dam/kioxia/shared/business/ssd/data-center-ssd/asset/productbrief/dSSD-CD6-R-product-brief.pdf.
[5] Solidigm. D5-P5430 product specifications and current five-quarter roadmap.
[6] Comparing TCO of a 30.72TB Solidigm™ D5-P5430 with 7000MBs throughput, 25W average active power, 5W idle power vs a 15.36TB (highest capacity available) Micron 7450 (datasheet) with 6800 MB/s throughput, 20W average active write power, 5W idle power. Assumes 42U rack capacity, 34U available for storage, 2U servers @ 24x U.3 TLC and 36x E3.S QLC drives per server. Calculated duty cycles to deliver equivalent throughput per TB: 20% for TLC array, 38.9% for all-QLC solution. RAID1 mirroring and 5-year refresh used for both. Key common cost assumptions : Power Cost = $0.15/KWHr, PUE factor = 1.60, Empty Rack Purchase Cost = $1,200, System Cost = $10,000, Rack Cost for Deployment Term = $171,200. Calculations based on Solidigm TCO estimations as of March 2023 using internal Solidigm TCO estimator tool.
Solidigm technologies may require enabled hardware, software or service activation. No product or component can be absolutely secure. Your costs and results may vary. Performance varies by use, configuration and other factors. Solidigm is committed to respecting human rights and avoiding complicity in human rights abuses. Solidigm products and software are intended only to be used in applications that do not cause or contribute to a violation of an internationally recognized human right. Solidigm does not control or audit third-party data. You should consult other sources to evaluate accuracy.
Product labels may differ.
© Solidigm 2023. All rights reserved.