Efficiently Accelerate Access to More Warm Data with Solidigm QLC 3D NAND Technology
Compared to HDDs, the Solidigm SSD D5-P5316 can provide:
- Up to 20x reduction of your warm data storage footprint [1]
- Up to 25x the sequential read performance [2]
And because QLC 3D NAND SSDs deliver density optimizations along with TLC-like read performance, they can help significantly lower capital expenditures (CapEx) for read-intensive storage workloads.

Solidigm QLC 3D NAND SSDs boost capacity and performance over HDDs
Modern, mission-critical workloads like artificial intelligence (AI), big data analytics, and content-delivery networks (CDNs) all rely on fast access to enormous and growing quantities of data. But when it comes to storage for that data, organizations struggle to balance performance, capacity, cost, and reliability.
Hard disk drives (HDDs) offer low-cost, high-capacity storage, but they can’t keep pace with the fast read access required by modern applications. Triple-level cell (TLC) NAND solid state drives (SSDs) offer higher performance for mixed workloads and write-heavy workloads, such as caching applications, but they typically can’t meet the cost and capacity requirements of modern, read-centric data workloads. As a result, businesses face a cost/performance gap between HDDs and TLC NAND SSDs.
Quad-level cell (QLC) NAND SSDs can help fill that gap because they combine large, cost-effective capacity with exceptional read performance for warm data. In particular, Solidigm QLC 3D NAND SSDs deliver proven endurance, reliability, and read-optimized performance, while helping lower your total cost of ownership (TCO) through consolidation in the data center.
Proven endurance for real-world workloads
Drive endurance is typically measured either in drive writes per day (DWPD) or total bytes written, expressed as either terabytes written (TBW) or petabytes written (PBW). Measured endurance is based on a Joint Electron Device Engineering Council (JEDEC) specification for a near-worst-case scenario, with a 40/60 read/ write workload with 100% random writes and a 4K block size. This scenario is not representative of the types of read-heavy workloads described earlier, such as those used in AI or with CDNs.
Of the two measurements, Solidigm believes PBW provides a more accurate representation of endurance. DWPD does not take into account capacity, even though the extra space in high-capacity SSDs can increase endurance by distributing wear across a large drive footprint. In contrast, PBW describes the total amount of data that can be written to a drive over its stated lifespan. By factoring in capacity, PBW provides a more useful and realistic measurement for comparing large-capacity QLC NAND SSDs to a wider range of SSDs and HDDs. Based on PBW, the Solidigm SSD D5-P5316 provides industry-leading levels of endurance for QLC NAND SSDs, while far outpacing endurance levels for HDDs, as shown in Figure 1. [3]
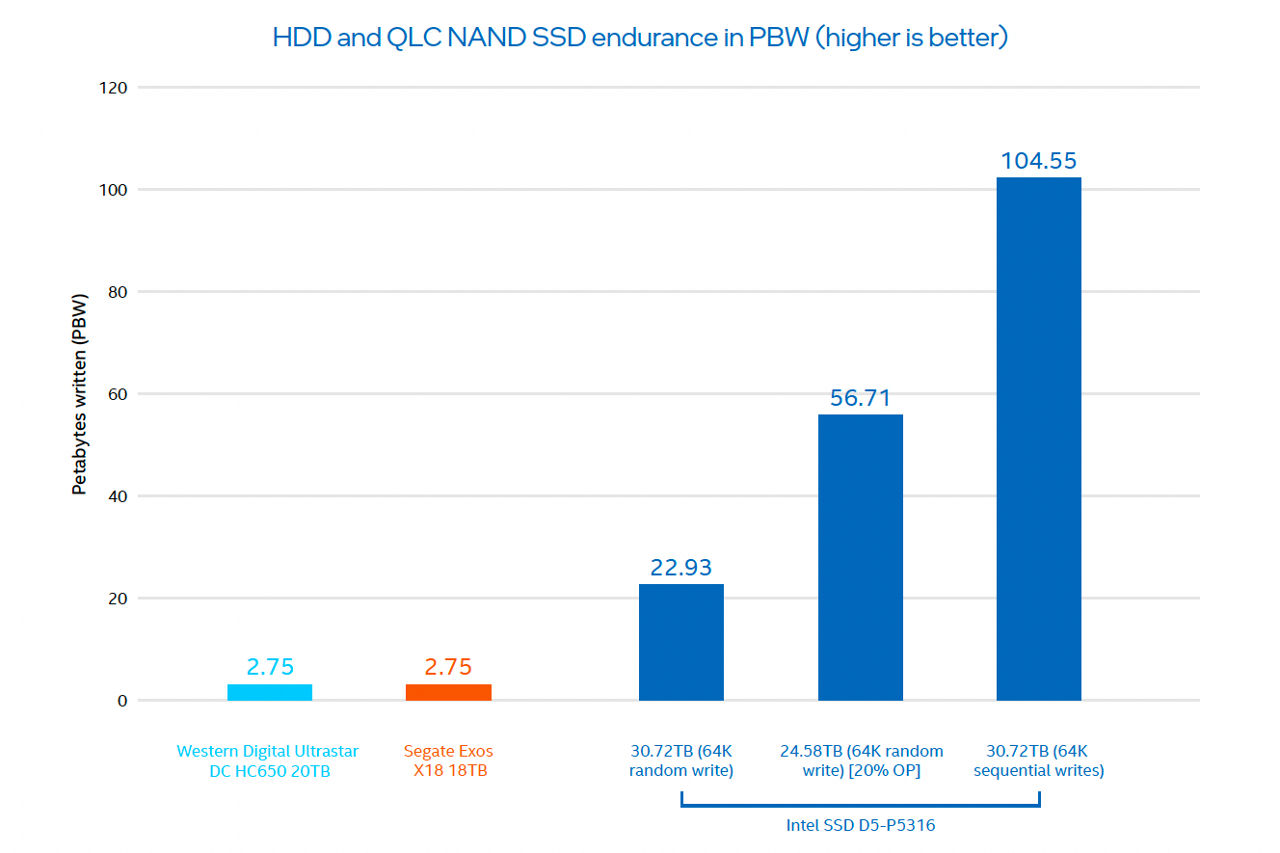
Figure 1. The Solidigm SSD D5-P5316 provides levels of endurance between 8x and 38x higher than two common enterprise HDDs [3]
Figure 1 also highlights the connection between QLC NAND SSD endurance levels and application workloads. For example, if an application is dependent on sequential reads of large block data, it will tax a QLC NAND SSD far less than an application that relies on frequent random writes of small block sizes. A large-scale study presented at a USENIX conference in February 2020 further demonstrates how QLC NAND SSDs can provide adequate levels of endurance for the read-centric workloads modern businesses rely on. As the study’s authors stated, “We predict that for the vast majority of enterprise users, a move towards QLC’s PE cycle limits poses no risks, as 99% of systems use at most 15% of the rated life of their drives.” [4]
Quality and reliability for the data center
Solidigm QLC 3D NAND SSDs offer levels of reliability that are much greater than HDDs, with levels equivalent to TLC NAND SSDs. The Solidigm SSD D5-P5316, for example, delivers an uncorrectable-bit error rate (UBER) two orders of magnitude higher than two common enterprise HDDs, [5] while providing an endurance rating 8x to 38x higher, based on PBW. [3]
Furthermore, real-world reliability measurements for NAND SSDs have been shown to be even higher than expectations. The large-scale study presented at the February 2020 USENIX conference found that average annual replacement rates (ARRs) for NAND SSDs vary from as little as 0.07% to nearly 1.2%, compared to between 2% and 9% for HDDs.
Comparing the two ranges shows NAND SSDs delivering between 7.5x and 28x lower ARRs than their HDD counterparts. [4]
Reducing TCO through consolidation
Several attributes give SSDs a distinct consolidation advantage over HDDs. Unlike HDDs, NAND SSDs do not require replication to achieve acceptable levels of performance, and they generally require much less replication than HDDs for reliability. Higher SSD performance also allows for more efficient data-reduction methods than HDDs. And because modern compression and deduplication algorithms are optimized for SSDs, the raw storage capacity needed to meet a “usable capacity” requirement is far less than with HDDs.
These SSD consolidation advantages can result in significant cost savings over HDDs for warm-data storage, particularly as NAND SSD costs continue to decline. According to the Wikibon research analyst David Floyer, production efficiencies will result in SSDs becoming cheaper than HDDs on a dollar-per-terabyte basis by 2026. [6]
While not as large as the HDD replacement opportunity, QLC NAND SSDs can still offer significant savings over TLC SSD deployments. QLC NAND offers a CapEx advantage from higher-density storage and the resulting cost-per-TB savings, compared to TLC NAND. And because read performance is equivalent to TLC NAND, QLC NAND offers a compelling TCO opportunity for read-intensive workloads.
Consolidating data results in major savings for CDNs
CDNs, such as video-on-demand (VoD) networks, offer an ideal case study for using Solidigm QLC 3D NAND SSDs instead of HDDs to consolidate storage while providing the levels of performance and endurance needed to meet stringent service level agreements (SLAs).
Take a theoretical mid-tier CDN deployment using a mix of HDDs and TLC NAND SSDs. To meet SLAs, the arrays require 480TB-per-node capacity and 190 Gbps-per-node throughput. At 111TB and 51 Gbps per server, HDD storage would need to be significantly overprovisioned beyond capacity needs in order to meet total throughput requirements. Replacing the overprovisioned array in this example with all QLC NAND SSDs would result in a nearly 5x consolidation of servers and a TCO reduction of up to 42 percent. [7]
These impressive gains are driven by the read-optimized performance of QLC NAND SSDs, which enable organizations to eliminate using TLC NAND SSDs as cache drives and replace HDDs with more space- and operationally-efficient capacity storage.
Extract more value from your warm data
With high capacity, read-optimized Solidigm QLC 3D NAND SSDs, you can rely on a proven technology to derive more value from more of your warm data, while helping to reduce TCO. Read the white paper, “QLC NAND Technology Is Ready for Mainstream Use in the Data Center,” for the full story.
[1] “Up to 20x reduction of warm storage footprint” claim is based on comparing 4TB HDDs, which require 10 (2U) of rack space to fill up 1PB or storage, against 30.72TB Solidigm SSD D5-5316 E1.L or U.2 drives, which take 1U of rack space to fill up 1PB of storage. That’s up to 20x greater rack consolidation.
[2] Sequential read performance based on Solidigm SSD D5-P5316 (https://www.solidigm.com/products/data-center/d5/p5316.html) compared to Seagate Exos X18 (seagate.com/files/www-content/datasheets/pdfs/exos-x18-channel-DS2045-1-2007GB-enSG.pdf).
[3] Solidigm SSD D5-P5316 drive endurance is based on 64KB random write and 64KB sequential write workload. “20% OP” represents endurance for an over-provisioned drive. Over-provisioning can be done by creating a namespace with a size of 80% of the available area. Seagate Exos X18 endurance is derived from the Seagate datasheet: seagate.com/files/ www-content/datasheets/pdfs/exos-x18-channel-DS2045-1-2007GB-enSG.pdf. Western Digital Ultrastar DC HC650 endurance is derived from the Western Digital datasheet: https://documents.westerndigital.com/content/dam/doc-library/enus/assets/public/western-digital/product/data-center-drives/ultrastar-dc-hc600-series/data-sheet-ultrastar-dc-hc650.pdf. HDD DWPD calculation: (550TB/year)/365 days/capacity (TB). HDD PBW calculation: ((550TB/year)*5 years)/1000.
[4] Stathis Maneas and Kaveh Mahdaviani, University of Toronto; Tim Emami, NetApp; Bianca Schroeder, University of Toronto. “A Study of SSD Reliability in Large Scale Enterprise Storage Deployments.” February 2020. usenix.org/system/files/fast20-maneas.pdf.
[5] Sources for reliability ratings: Solidigm. “Solidigm SSD D5-5316 provides industry-leading endurance at 0.41 DWPD.” https://www.solidigm.com/products/data-center/d5.html. Western Digital Data Sheet: Ultrastar DC HC650. https://documents.westerndigital.com/content/dam/doc-library/enus/assets/public/ western-digital/product/data-center-drives/ultrastar-dc-hc600-series/data-sheet-ultrastar-dc-hc650.pdf. Seagate Data Sheet: Exos X18. seagate.com/files/www-content/datasheets/pdfs/ exos-x18-channel-DS2045-1-2007GB-enSG.pdf.
[6] Wikibon. “QLC Flash HAMRs HDD.” January 2021. https://wikibon.com/qlc-flash-hamrs-hdd/.
[7] Source for consolidating servers by nearly 5x and reducing TCO by up to 42 percent when upgrading from a hybrid TLC SSD and HDD array to an all-QLC SSD array: Baseline server assumptions of 20K actives users, minimum capacity of 480TB, target throughput of 190 Gbps, and 85 percent cache hit ratio. Hybrid array per server configuration of 2 x Intel Xeon Scalable 6330 processors, 512GB memory, 12 x 8TB Seagate Exos HDD with 2.088 Gbps throughput, 2 x 7.68TB Solidigm SSD D7-P5510 with 56 Gbps throughput. Hybrid array cost (CPU + memory + RAID controller + NVM Express [NVMe] expander + chassis + power supply) net of storage: $10,530. All-QLC per server configuration of 2 x Intel Xeon Scalable 6338N processors, 512GB memory, 20 x 30.72TB Solidigm SSD D5-P5316 with 54.4 Gbps throughput. All-QLC server cost (CPU + memory + RAID controller + NVMe expander + chassis + power supply) net of storage: $11,530. HDD pricing from serversupply.com/HARD%20DRIVES/SATA-6GBPS/8TB-7200RPM/SEAGATE/ST8000NM000A326073.html, as of March 15, 2021. SSD pricing is Solidigm budgetary pricing. Actual price can vary and may not reflect the pricing used in the TCO model. Operating cost assumptions of 1,100watts/server $0.12/kWh power and cooling and $75.76 annual rack cost per RU.
Performance varies by use, configuration and other factors. Learn more at https://www.solidigm.com/products/data-center.
Performance results are based on testing as of dates shown in configurations and may not reflect all publicly available updates. See backup for configuration details. No product or component can be absolutely secure.
Your costs and results may vary.
Solidigm technologies may require enabled hardware, software or service activation.
Solidigm does not control or audit third-party data. You should consult other sources to evaluate accuracy.
© Solidigm 2022