Solidigm™ D5-P5316 Product Brief
Formerly Intel® SSD D5-P5316
Combining the industry’s first 144-layer QLC NAND and PCIe 4.0, the read-optimized Solidigm D5-P5316 SSD enables significant TCO savings while accelerating warm storage.
As data volume increases, storage becomes a growing challenge in terms of cost-effectiveness, physical footprint, and performance. Built with Solidigm’s most advanced Quad-Level Cell NAND, the Solidigm SSD D5-P5316 addresses those challenges by delivering industry-leading SSD storage density with the high bandwidth performance of a PCIe 4.0 interface.
The Solidigm D5-P5316 SSD includes up to 30.72TB of capacity, and as an E1.L, provides up to 1 petabyte (PB) of storage in just 1U of rack space. The result is massive storage consolidation for lower TCO.
- Built on industry’s first 144-layer QLC
- Consolidate and accelerate warm storage
- Enables up to 1PB of storage in just 1U
- Same quality and reliability as TLC
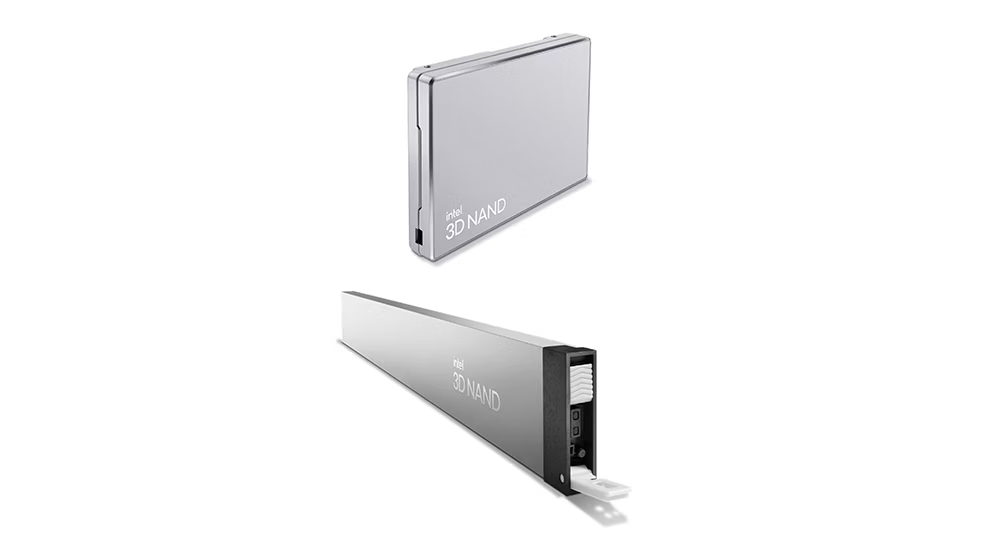
- Available in U.2 and E1.L form factor
Unlock the value of stored data
Based on PCIe 4.0, the D5-P5316 SSD not only accelerates legacy HDD-based systems but also prior generation Solidigm SSD-based systems. Compared to HDDs, Solidigm’s newest SSD can accelerate access to stored data by up to 25x1 while performance optimizations bring up to 2x higher sequential read performance,2 up to 38% higher random read performance,3 up to 48% better latency,4 and up to 5x higher endurance versus the previous generation Solidigm SSD family.5
In addition to increased performance, the Solidigm D5-P5316 SSD offers storage footprint consolidation with up to 20x reduction of warm storage footprint.6 Storage consolidation enables further operational savings, including power consumption, cooling costs, drive replacement, and technician support.
Firmware enhancements for drive performance, IT efficiency, data security, and manageability
The Solidigm D5-P5316 SSD includes numerous firmware enhancements specifically optimized for both enterprise and cloud workloads to deliver better latency,4 expanded management capabilities, and critical new NVMe features.
- NVMe 1.3c and NVMe-MI1.0a-compliant
- Scatter Gather List (SGL) removes the need to double-buffer host data
- Persistent Event Log exposes deeper drive history for debugging at scale
- Designed to enhance security with AES-256 Hardware Encryption, NVMe Sanitize, Firmware Measurement
- Telemetry makes a wide range of stored data accessible and includes intelligent error tracking and logging. This increases the reliability of finding and mitigating issues and supports accelerated qualification cycles—all of which result in increased IT efficiency
Accelerate a range of data center workloads
The D5-P5316 SSD is designed from the ground up to optimize and accelerate storage in a range of data center workloads including Content Delivery Networks (CDNs), Artificial intelligence (AI), Hyper Converged Infrastructure (HCI), Big Data, , Cloud Elastic Storage (CES), and High Performance Computing (HPC). Key architectural improvements accelerate a broad range of read workloads as well as large block sequential/random writes, while maintaining fast response time SLAs due to a newly-designed Quality of Service scheme that maintains low read latency under write pressure.
NAND technology industry leader
Solidigm’s 144-layer 3D NAND technology delivers industry-leading areal density7 and data retention,8 enabling enterprise customers to confidently scale storage arrays to meet their growing needs. The industry's swift adoption of software-defined and hyperconverged infrastructures increases the need to maximize efficiency, revitalize existing hardware, and increase server agility—all while maintaining operational reliability.

Notes
Test and System Configuration for footnotes 1-6: Testing by Solidigm. Mainboard: Solidigm Server Board S2600WFT, Version: R2208WFTZS, BIOS: SE5C620.86B.00.01.0014.070920180847, Platform architecture: x86_64, CPU: Intel Xeon® Gold 6140 CPU @ 2.30GHz, CPU Sockets: 2, RAM Capacity: 32G, RAM Model: DDR4, OS version: centos-release-7-5, Build id: 1804, kernel: 4.14.74, NVMe Driver: Inbox, Fio version: 3.5, G4SAC PCIe Gen4 switch PCIe card (Microsemi). Solidigm SSD D5-P5316 was tested on ACV10100 firmware. Testing as of March 2021.
[1] Sequential read performance based on Solidigm SSD D5-P5316 compared to Seagate Exos X18 (www.seagate.com/files/www-content/datasheets/pdfs/exos-x18-channel-DS2045-1-2007GB-en_SG.pdf).
[2] Up to 2x higher sequential read - Comparing 128K sequential read bandwidth between Solidigm SSD D5-P5316 15.36TB (7.0 GB/s) and Solidigm SSD D5-P4326 15.36TB (3.2 GB/s).
[3] Up to 38% higher random read - Comparing 4K random read between Solidigm SSD D5-P5316 15.36TB (800K IOPS) and Solidigm SSD D5-P4326 15.36TB (580K IOPS)
[4] Up to 48% better latency performance at 99.999%: Source-Solidigm product specification. Comparing measured performance for 4KB Random Read, QD1 latency performance at 99.999% between Solidigm SSD D5-P5316 15.36TB with Solidigm SSD D5-P4326 15.36TB. Measured performance are 600us and 1150 us for Solidigm SSD D5-P5316 and Solidigm SSD D5-P4326 respectively. Percentage change is 48%.
[5] Up to 5x higher endurance gen over gen - Comparing endurance (64K random write) between Solidigm SSD D5-P5316 30.72TB (22,930 TBW) and Solidigm SSD D5-P4326 15.36TB (4,400 TBW).
[6] Up to 20x Reduction of Warm Storage Footprint. With 4TB HDD drive, it takes 10 (2U) of rack space to fill up 1PB or storage. With Solidigm SSD D5-P5316 30.72TB E1.L or U.2, it takes 1U of rackspace to fill up 1PB of storage. That’s up to 20x greater rack consolidation.
[7] Source: ISSCC 2015, J. Im; ISSCC 2017 R Yamashita; ISSCC 2017 C Kim; ISSCC 2018; H. Maejima; ISSCC 2019 C. Siau.
[8] Measurements were performed on components from SSDs using floating gate and charge trap flash technology. Measurement platform used was Teradyne Magnum 2 Memory test systems, and programming using random patterns and margins were quantified using customer commands. Data measured in 08/2019.
Disclaimers
All information provided is subject to change at any time, without notice. Solidigm™ may make changes to manufacturing life cycle, specifications, and product descriptions at any time, without notice. The information herein is provided “as-is” and Solidigm does not make any representations or warranties whatsoever regarding accuracy of the information, nor on the product features, availability, functionality, or compatibility of the products listed. Please contact system vendor for more information on specific products or systems.
Performance results are based on testing as of dates shown in configurations and may not reflect all publicly available updates. See backup for configuration details. No product or component can be absolutely secure.
Performance varies by use, configuration, and other factors.
Refer to the spec sheet for formal definitions of product properties and features.
Solidigm technologies may require enabled hardware, software, or service activation. No product or component can be secure. Your costs and results may vary. Performance varies by use, configuration and other factors. Other names and brands may be claimed as property of others. Solidigm is committed to respecting human rights and avoiding complicity in human rights abuses. Solidigm products and software are intended only to be used in applications that do not cause or contribute to a violation of an internationally recognized human right.
Solidigm and the Solidigm logo are trademarks of Solidigm. All other trademarks are the property of their respective owners.
© Solidigm 2025. All rights reserved.